Connect with us

Story behind the figures

GTCO grows gross earnings by 20.4%, to pay N3.10 total dividend

Published

on

By Philemon Adedeji

Guaranty Trust Holding Company Plc (“GTCO” or the “Group”), a multinational financial services group, in its Audited Consolidated and Separate Financial Statements for the year ended December 31, 2022, to the Nigerian Exchange Group (NGX) and London Stock Exchange (LSE)  delivered show a commendable top-line performance as gross earnings increased stronger.

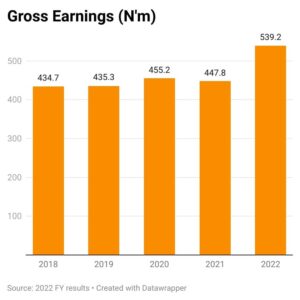
In the audited results the group gross earnings rose significantly by 20.42 per cent year-on-year to N539.23 billion as of end of December 31, 2022 from N447.81 billion recorded in the previous year, this was largely driven by a 21.92 per cent y/y rise in interest income to N325.40 billion which was buoyed by the increase in interest income on financial assets from N15.43 billion in 2021 to N30.28 billion in the period under review.

Similarly, Interest expense surged by 42.82 per cent y/y to N66.09 billion due to the 43.70 per cent y/y rise in deposit from customers to N59.75 billion, while other borrowed funds rose by 62.08 per cent y/y to N4.36 billion.

Moreso, Non-Interest Income witnessed an increase of about 16.36 per cent y/y to N200.68 billion for full year 2022.

“We opine that the aggressive contractionary policy moves by the CBN which has led to higher interest rates and tighter financial conditions, as well as the decline in CASA mix (+93.82 per cent in FY 2022 vs +97.09 per cent in FY 2021) pushed cost of funding higher. Nonetheless, net interest income remained positive and higher for the period by 17.54 per cent at N259.30 billion.

Moving further down the line, loan impairment charges grew by 40.50 per cent to N11.98 billion, resulting from an increase in loans and advances to banks and customers by 10.17 per cent and 38.17 per cent to N129.44 billion and N11.91 billion, respectively.

Furthermore, a significant increase in net impairment charge on financial assets amounted to N35.94 billion in FY 2022, compared to N760.79 million recorded in the prior financial year 2021.

The steep rise in net impairment charge can be mostly attributed to the group’s exposure to securities issued by the Ghanian Government which were hit by substantial losses after the decision to restructure both local and external debt to secure a $3 billion bailout from the IMF.

In addition, operating expense (OPEX) was up by 43.44 per cent y/y to N197.89 billion on the back of increases in administrative expenses (+67.11 per cent y/y), general welfare expenses (+76.00 per cent y/y) and customer service-related expenses (+135.06 per cent y/y).

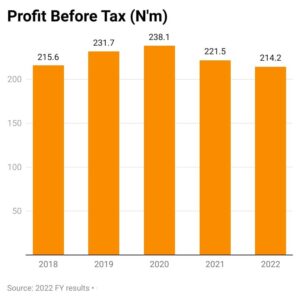
Consequently, bottom-line was marginally suppressed due to the expansion in impairment charges and operating expenses as Profit Before Tax (PBT) declined by 3.3 per cent y/y to N214.2 billion in full year 2022 from N221.5 billion achieved in Full year 2021.

From the profit and loss figures the group Profit After Tax (PAT) reported decreased by 3.25 per cent y/y from N174.8 billion accounted in 12 months of 2021 to N169.2 billion accounted in 12 months of 2022

However, the board of Director has recommended the payment of a final dividend of N2.80k per ordinary share of 50 Kobo, bringing the total dividend for the financial year ended December 31, 2022, to N3.10K.

On a sequential basis, the increase in interest income (+8.93 per cent q/q) and non-interest income (+108.76 per cent q/q) supported gross earnings which grew by 39.93 per cent q/q.

However, the 4498.43 per cent q/q and 46.15 per cent q/q rise in loan impairment charges and OPEX weighed on PBT, leading to a decline of 215.35 per cent q/q. Also, the significant jump of 308.39 per cent in tax rate further drove PAT downwards by 358.07 per cent q/q.

Earnings per share recorded for the period under review declined by 3.1 per cent to 5.95 Kobo in 2022 from 6.14 Kobo in 2021.

Essentially, the group recorded impressive top line performance despite the challenging macroeconomic condition and losses on debt instruments which affected bottom-line performance.

Nevertheless, we are of the view that Guaranty Trust Holding Company (GTCO) remains one of the key names for opportunities in the banking sector given its strong fundamentals and formidable historical performance.

The Group’s loan book (net) increased by 4.6 per cent from N1.80 trillion as of December 2021 to N1.89 trillion in December 2022, while deposit liabilities grew by 11.6 per cent from N4.13 trillion to N4.61 trillion during the same period.

The Group’s balance sheet remains resilient with total assets and shareholders’ funds closing at N6.45 trillion and N931.1 billion, respectively, while Total liabilities added 21.1 per cent to N5.5 billion in 2022 from N4.552 billion in 2021.

While shareholder return, quality service delivery to customers, and the firm’s value are essential, the Group posted a Pre-tax Return on Average Assets of 3.6 per cent and a Pre-tax Return on Average Equity of 23.6 per cent despite the muted net interest margin/loan growth and challenges in the operating environment, which had negative implications for individuals, households, and businesses.

Capital Adequacy Ratio (CAR) remained very strong, closing at 24.1 per cent . Similarly, asset quality was sustained as IFRS 9 Stage 3 Loans ratio (NPLs) improved to 5.2 per cent in December 2022 from 6.0 per cent in December 2021, however, Cost of Risk (COR) inched up marginally to 0.6 per cent in FY-2022 from 0.5 per cent in December 2021 due to impact of worsened macros on PDs.

The Vice Chairman of Highcap Securities Limited, David Andori commented on the results that the decline in Profit despite huge Gross earnings is due to high operating cost. The increase in total assets may be due to exchange rate revaluation. Despite decline in profit, the dividend payout is commendable.

Conclusion

Commenting on the results, the Group Chief Executive Officer of Guaranty Trust Holding Company Plc (GTCO Plc), Mr. Segun Agbaje, said that the Group’s ability to navigate the peculiar challenges in the different markets where it operates underscores its strong business fundamentals and unwavering commitment to sound business strategies.

“Despite the varying challenges and headwinds that weighed on growth in 2022, we were determined to deliver a decent performance and scale effectively to strengthen our competitive edge and drive long-term growth.”

He further stated; “As an organisation, 2022 was quite significant for us being the first year after our corporate restructuring into a financial holding company in August 2021.

Today, across our Banking, Payment, Funds Management, and Pension businesses, we have successfully built a robust ecosystem with immense potential to deepen our addressable market and create more value for all our stakeholders.

“We will continue to prioritise innovation, service excellence, and execute seamlessly towards achieving our vision of leading financial services in Africa.”

Story behind the figures

BUA Cement Plc: Lower profitability but good outing

Published

on

Introduction

A thorough analysis of BUA Cement’s  current financial report shows that the 2023 financial year was a good one for the company. However, we will not quite classify the year as a great one. This is because while the company had good results and competed favourably against industry standards, its results were not as great as its preceding year’s results.

It remains to be seen whether the cement company will maintain the status quo for 2024 or up its ante to outperform its own 2023 results.

Growth indices

For its 2023 financial year, BUA Cement recorded a growth in its gross earnings. Gross earnings for the year stood at N459.9 billion, 27.4 per cent higher than the N360.9 billion recorded in the preceding year. This 27.4 per cent growth rate is as compared to a higher growth rate of 40.3 percent in 2022.

Because direct costs grew a little faster than turnover did, gross profit did not rise as commendably as turnover did, growing by a lower 12.8 percent to N183.4 billion. Meanwhile, non-direct costs more than doubled, and this ate into the company’s pre-tax loss. BUA Cement was left with a pre-tax profit of N67.2 billion, 44.0 percent lower than the N120.1 billion pre-tax profit recorded in the erstwhile year. This 44 percent decline rate is as compared to a pre-tax profit growth rate of 16.7 percent in the preceding year.

After-tax profit also declined over the preceding year’s by 31.2 percent, closing at N69.5 billion, while distributable profit was N68.9 billion, 31.8 percent less than the 2022 result.

Total assets for the year stood at N1.21 trillion, up from N874 billion in 2022 and translating into a 39.1 percent growth rate. Total liabilities, however, grew much faster by 79.5 percent to N830.5 billion from N462.8 billion, while shareholders’ funds declined by 6.3 percent to N385.2 billion from N411.2 billion in the erstwhile year.

Profitability ratios

There was a general decline in the company’s profitability ratios for 2023. Profit margin for 2023 stood at 14.6 percent, down from 33.3 percent in the preceding year. What this means is that a lower N14.60 was able to make it to the profit position for every N100 earned in 2023, down from N33.30 in 2022.

Return on assets (ROA) followed a similar pattern. ROA for the year declined to 5.5 percent from 13.7 percent in 2022, meaning that every N100 worth of assets deployed contributed N5.50 to the pre-tax profit for the year, lower than the N13.70 recorded in 2022.

Return on equity (ROE) also declined to a three year low of 18.0 percent from 24.6 percent, meaning that every N100 worth of equity employed contributed N18.00 to the after-tax profit in 2023, up from N24.60 in the prior year.

Perhaps the depreciating results for the year can be traced to an increasing operating margin. For the year, operating margin (which measures what proportion of turnover is used to finance operations) grew, and thus dipped, to 24.2 percent from a lower and better 15.2 percent 2022.

It is important to note that while the profitability ratios were lower than those of the prior year, they were high enough in their own rights.

Staff matters

In terms of staff matters, the company did quite well for the year ended December 31, 2023. However, the results for the year were not as good as the ones it saw in the prior year. On the average, each employee contributed N53.46 million to the company’s pre-tax profit, high enough but sizably down from N102.73 million in the prior year.

Despite this, BUA Cement increased its staff cost per employee. On the average, wages and salaries earned by each staff increased to N8.56 million during the course of the year, up from N6.94 million in the preceding year.

Despite this, the company did not put itself out more than was necessary. Staff costs as a proportion of turnover pretty much stayed at the same level per cent during the course of the year. The result was 2.3 percent, not much different from the 2.2 per cent recorded in the prior year.

Other ratios

For the year, BUA Cement’s short-term assets increased to N399.3 million while its short-term liabilities increased to a collective N377.1 million. The interplay between these two had a bettering effect on its current ratio. At 1.1 times, current ratio was better than that of the prior year and competed favourably against industry standards. What this means is that for every one Naira of short-term obligations, the company had N1.10 in short-term assets, and was more than able to meet obligations as at when due.

The company had a debt-to-equity ratio of 2.2 and this shows that the company is using exactly N2.20 of liabilities in addition to each N1.00 of stockholders’ equity. In other words, the company is using N3.20 of total capital for every N1.00 of equity capital, higher than it was in 2022.

Lafarge Vs BUA Cement: Evenly matched

Sometimes, it is important to do a comparison analysis to understand how a company is truly faring. To this end, we conducted a comparison analysis between Lafarge and BUA Cement, which are both well-known names in the cement industry.

In terms of size, BUA Cement is the slightly bigger of the two. However, these two companies are evenly matched in terms of their profitability ratios.

Turnover growth rate

Lafarge had a turnover growth rate of 8.7 percent in 2023. BUA Cement also recorded a higher level of turnover, with such turnover growing by a much higher 27.5 percent. BUA Cement is thus the winner in this respect.

Pre-tax profit growth rate

For the year, Lafarge had a better result in terms of pre-tax profit growth rate. Its pretax profit grew by 15.6 percent. On the other hand,  BUA Cement recorded a decline rather than a growth. This made Lafarge the winner in this aspect.

Profit margin

When it comes to profit margin, Lafarge was the winner. Its profit  margin stood at 19.9 percent, higher than and better than BUA Cement’s 14.6 percent profit margin result.

Returns on equity

BUA Cement was the clear winner when it comes to return on equity. Its return on equity was 18.0 percent, meaning that every N100 worth of equity contributed N18.00 to the after-tax profit. This was much higher than Lafarge’s N11.70 contribution.

Return on assets

Contrary to ROE, Lafarge was the winner when it comes to return on assets (ROA). Lafarge had an ROA of 11.8 percent, higher and better than BUA Cement’s 5.4 percent.

Conclusion

In the above analysis, the profitability ratios of BUA Cement for the 2023 financial year were compared with its ratios for the 2022 year. Yes, BUA Cement did well for itself. Yet, its results were not as good as those of the prior year. Also, a second comparison is done against a competitor. Under this comparison, BUA Cement also did well as it stood its own against Lafarge, one of its competitors.

This suggests that while BUA Cement might not be doing as well as it did in prior years, it is still doing well enough to be relevant.

Continue Reading

Story behind the figures

Zenith Bank Plc: A profitable outing

Published

on

Introduction

Our analysis of Zenith Bank’s 2023 recent annual report shows that the year was quite a profitable one for the bank. Not only did the bank record a commendable growth in its turnover, it was also able to maintain such momentum to its profit.

As a direct fallout, the bank’s profitability ratios (such as profit margin, return on assets, return on equity, net interest margin and pre-tax profit per employee) remained high enough for the bank to remain relevant. It is important to note that the bank is also doing very well in its core banking operations.

Growth indices

For its 2023 financial year, the bank recorded a very commendable 125.4 percent growth in its turnover (inclusive of interest and discount income, and income from non-banking operations). Such turnover rose to an all-time high of N2.13 trillion from N945.6 billion in the preceding year.

It is worthy of note that while the bulk of the bank’s turnover was contributed via interest and discount income, it also stepped up the tempo of its non-core banking operations during the course of the year and earned significantly more money from there.

Pre-tax profit growth rate followed an even more commendable pattern, growing much more steeply as compared to the growth recorded in the prior year. Profit before tax obligations for 2023 stood at N795.9 billion, up from N284.7 billion in the erstwhile year, and translating into a 179.6 percent growth rate. After-tax profit followed the same pattern as pre-tax profit did, growing commendably by 202.3 percent over the preceding year’s level.

Total assets deployed by the bank for the 2023 year improved to a higher level of N20.4 trillion, about 65.8 percent higher than the N12.3 trillion assets deployed in December 2022, while shareholders’ funds advanced to N2.3 trillion from N1.4 trillion.

Profitability ratios

In all ways, the 2023 financial year was a profitable one for Zenith, as it recorded a marked improvement in almost all of its profitability ratios.

First, the bank did well in the execution of core banking operations, as shown by its net interest margin. Zenith recorded a net interest margin of 64.3 per cent. This interest margin, although lower than what the bank recorded in the preceding year, was on par with the industry average for 2023. This lower 64.3 percent net interest margin happened despite the increasing gap between the bank’s lending rate (which grew to 17.5 percent in 2023 from 13.5 percent in December 2022) and its deposit rate (which grew to 2.7 percent from 1.9 percent).

Profit margin also grew to 37.3 percent in 2023 from 30.1 percent in December 2022. What this means is that for every N100 earned by the bank in the course of the year, N37.30 made it to the profit position. This is as compared to N30.10 for the year preceding 2023.

Return on assets (ROA) also recorded an improvement. ROA grew to 3.9 percent in 2023 from 2.3 percent in December 2022. Analysis shows that every N100 worth of Zenith’s assets contributed N3.90 to its pre-tax profit in 2023, up from N2.30 in 2022.

For every N100 equity deployed, the bank made an after-tax profit of N29.10, up from N16.20 in the preceding year. Thus, return on equity for the year was also better than that of the prior year.

Asset quality

The proportion of Zenith’s gross loan stock that became classified in 2023 declined by increasing to 7.6 per cent from 5.8 per cent in 2022. Meanwhile, loan loss reserves for 2023 could cover only 20.4 percent of Zenith’s classified loans.

For 2023, the bank was not as careful to limit the portion of its equity stock that would be wiped out were its classified loans to become totally irrecoverable. Classified loans as a portion of shareholders funds stood at 23.4 percent in 2023, higher than 17.2 percent in 2022.

Staff matters

The bank did very well in matters regarding its employees for the year ended December 31 2023. Pre-tax profit per employee grew to N97.47 million on the average, better than the N35.25 million employees contributed on the average to the bank’s pre-tax profit in 2022.

The bank was, however, generous enough to compensate its employees more in 2023 than it did in December 2022. Average staff cost rose to N15.23 million from N10.69 million within the course of 12 months. This means that there was a N4.54 million addition to what an employee earned (on the average) between December 2023 and December 2022.

Despite the fact that it upped its staff costs, Zenith succeeded in deflating such staff costs as a proportion of income earned. Staff costs as a portion of turnover decreased to 5.8 percent in 2023 from 9.1 percent in December 2022.

Other ratios

Zenith’s equity (a company’s primary and cheapest source of funding) could finance 32.9 percent of the loans and advances it gave out to borrowers, down from 33.4 percent recorded in the erstwhile year.

Also, at 0.6 times, the current ratio was not on par with the industry average for 2023. What this means is that for every N1.00 of short-term obligations, the bank had only 60 kobo in short-term assets, and was not completely able to meet short term debts from short term assets.

Having a debt to equity ratio of 7.8 shows that the bank is using N7.80 of liabilities in addition to each N1.00 of stockholders’ equity. In other words, the bank is using N8.80 of total capital for every N1.00 of equity capital.

Return on equity

Another performance ratio in which Zenith did well was in its return on equity (ROE) of 29.9 percent. Zenith’s ROE for 2023 stood at 29.1 percent.

Return on assets

This was one of the ratios in which Zenith outperformed its peers. Its ROA was 3.9 per cent, higher and better.

Pre-tax profit margin

Although Zenith Bank was not able to grow its gross earnings and pre-tax profit as fast as its peers, it was however better able to translate its turnover into profit. For the 2023 financial year, pre-tax profit margin (which measures a company’s ability to squeeze as much profit as is possible from turnover) for Zenith Bank was 37.3 percent.

Conclusion

On its own, in a stand-alone analysis, Zenith Bank is doing quite well and this should be commended. It remains to be seen, however, if Zenith and UBA will be star performers in the banking industry for 2023, or if 2023 was a generally good year for all Nigerian banks.

Story behindthe figure

Continue Reading

Story behind the figures

Honeywell Flour Mills Plc: A tough year

Published

on

By Folakemi Emem-Akpan

Introduction

Honeywell Flour Mills Plc went the way of most other Nigerian companies in 2023, recording lower turnover. It went one step further and recorded downright end of the year losses. Because of the losses, the company did not have good profitability ratios and seems to be floundering. All in all, it was a tough year for the company.

Growth indices

Honeywell followed the general rule of earning more income in 2023 than it did in 2022. The growth in gross earnings, at 8.0 percent, was however lower than most other companies recorded. Gross earnings stood at N147.3 billion, a little higher than N136.4 billion in the prior year. Even though the company was careful to curtail cost of sales, it couldn’t quite do the same for operating expenses (inclusive of advertising and promotion, distribution, administrative and interest expenses). These grew much faster collectively in 2023 than in 2022.

For the second year in a row, Honeywell recorded a loss rather than a pre-tax profit. Loss before tax obligations for 2023 stood at a staggering N8.9 billion, a deeper loss than the N170 million pre-tax loss recorded in the prior year. After-tax loss was N260 million for the 2023 financial year, still a loss, but better than the N980 million loss recorded in 2022.

Total assets deployed by the company for the 2023 year grew to N165 billion, 11 per cent more than the N148.7 billion assets deployed in 2022. Meanwhile, shareholders’ funds declined by 27.5 per cent to N32.0 billion in the review year.

Profitability ratios

Not only did Honeywell record losses instead of profitability on a stand-alone analysis basis for the 2023 financial year, all parameters also showed a regression when compared to its preceding years’ result. First to achieve a regression was the profit margin of the company. Instead of a profit margin, there was a loss margin of 6.0 percent, meaning that for every N100 earned by the company in the course of the year, N6.00 of it translated to loss. This is as compared to a loss of 10 kobo in 2022.

Also to record a decline was return on assets (ROA). Loss on assets was 5.4 percent, as compared to a loss on assets of 0.1 percent in the erstwhile year. For the 2023 financial year, Honeywell deployed equity valued at N32.9 billion and for every N100 equity deployed, the company made an after-tax loss of 78 kobo.

The operating margin (which measures what proportion of turnover a company spends on operations and which must be kept as low as possible without compromising standards) was one of the reasons for the company’s bad results for the year. This is because such operating margin was 6.9 percent, higher and worse than the 5.2 percent recorded in the prior year.

Staff matters

As regards staff matters, pre-tax loss per employee stood at N10.9 million on the average. This is as compared to the N204 million pre-tax loss employees contributed on the average to the company’s pre-tax loss in 2022.

Average staff cost then increased significantly to N8.84 million from N5.99 million within the course of 12 months. This means that there was a N2.85 million addition to what an employee earned (on the average) between 2023 and 2022.

Perhaps, because it increased its staff costs, Honeywell did not succeed in deflating its staff costs as a proportion of income earned. Staff costs as a portion of turnover grew to 4.4 per cent in 2023, higher than 3.6 percent in 2022.

Other ratios

At 0.9 times, Honeywell’s current ratio was a little lower than the industry average for 2023. What this means is that for every N1.00 of short-term obligations, the company had 90 kobo in short-term assets, and was not fully able to meet short term debts from short term assets.

Having a debt-to-equity ratio of 4.0 shows that the company is using N4 of liabilities in addition to each N1.00 of stockholders’ equity. In other words, the company is using N5.00 of total capital for every N1.00 of equity capital, higher than it did in 2022.

Honeywell Vs Flour Mills: Still a loss

We have established that Honeywell did not improve its lot when its results are compared on a year on year basis. We can also establish that Honeywell did not compete favourably against other companies in the flour milling business for the 2023 FY. A comparison against Flour Mills buttresses this point.

While Flour Mills is easily the bigger of the two companies (in fact, it is the parent company of Honeywell), a bigger size does not automatically translate into better profitability. For the 2023 review year, Flour Mills was also the clear leader in terms of performance. Of six profitability ratios examined, Flour Mills led in all.

Turnover growth rate

For the 2023 financial year, Flour Mills had a turnover growth rate of 32.8 percent, as compared to Honeywell’s turnover growth rate of 8 per cent for the same period under review. Analysis shows that Flour Mills was the winner in this respect.

Pre-tax profit growth rate

For the year, Flour Mills’ profit before tax grew by a mere 1.5 percent. Yet, this was much better than the 5,074 percent decline Honeywell recorded. However, it is also important to note that while Flour Mills witnessed an actual growth, Honeywell had a pre-tax loss of N8.9 million.

Between turnover and profit

For the 2023 financial year, pre-tax profit margin (which measures a company’s ability to squeeze as much profit as is possible from turnover) for Honeywell was actually a pre-tax loss margin of (6.1) percent. Flour Mills, on the other hand, had a better pre-tax profit margin of 2.6 percent.

Return on equity

Flour Mills led its peers in terms of return on equity (ROE), recording an ROE of 13.1 per cent. Analysis shows that while every N100 worth of equity deployed by Flour Mills earned it N13.10 in after-tax profit, such N100 equity deployed earned Honeywell 78 kobo as after-tax loss.

Return on assets

ROA for Flour Mills was 3.7 percent, down from 5.9 percent in the prior year. This means that of every N100 worth of assets deployed by Flour Mills, N3.70 accrued to it as pre-tax profit while Honeywell recorded a N5.40 pre-tax loss from every N100 worth of assets employed.

Pre-tax profit per employee

For the 2023 financial year, Flour Mills recorded a pre-tax profit per employee of N6.72 million, much better than Honeywell’s N10.9 million pre-tax loss per employee.

Conclusion

Honeywell’s loss for its 2023 financial year shows how events beyond a company’s control can have an effect, either negative or positive, on its bottom line. It is clear that the economic recession Nigeria has been experiencing had a severely limiting effect on Honeywell’s revenues and performance. It remains to be seen what the 2024 FY will hold for the company.

Continue Reading

Trending